For quite some time now I have been intrigued by the challenge of trying to link the results of the Jan Warnqvist test to the conversion composition of the biodiesel from which the test sample was taken. Arguments have been put forward and refuted by various contributors but nobody has really been able to be quantitative in a meaningful way. Recently I rekindled some skills from a former life, so to speak, when I was involved professionally in mathematical modelling. I have developed a basic mathematical model to simulate the chemistry of the biodiesel reaction and I am happy with provisional results. I am not a chemist! This is not a predictive deterministic model in the sense that if you input known quantities for all your variables such as temperature, processor dynamics, quantities of methanol and caustic etc. etc. this will predict what is going to happen. That is simply not possible and anyhow we all know in our own way what works for us and we can all make good biodiesel. This model is a reactive model in the sense that if you perform the Warnqvist methanol test and measure the dropout then it can tell you the mass distribution of glycerides in the biodiesel that you took the sample from. To paraphrase, if you get xml of dropout in a Warnqvist methanol test you can use the model to determine what the most likely mass distribution of triglycerides, diglycerides and monoglycerides is in your biodiesel.
Now this is where I need some help! I need to make the best educated estimate I can (or use actual experimental data if some exists) as to the solubility of monoglycerides and diglycerides in methanol. Specifically I need to make this estimate with some agreed conditions so that I can standardise the approach: the nature of the feedstock oil (soy,rape,etc), the purity of methanol, the temperature of the test and how long we wait to determine dropout amount are all things which need to be assumed. I am calling out to the extensive pool of knowledge and experience that exists on this forum to make this estimate, primarily in relation to the methanol solubility of monoglycerides and diglycerides of the feedstock oils: soybean and rapeseed/canola.
Just so I could run the program and get some feel for results I made an initial guess that the Warnqvist test dropout would contain all the triglycerides present in the biodiesel sample that went into the test, 2/3 of the diglycerides present in the biodiesel sample and 1/3 of the monoglycerides present in the biodiesel sample. I made this guess based on a crude polarity argument that the diglycerides are sufficiently non-polar that most, 2/3, of them will fall out of the methanol and that the monoglycerides are sufficiently polar that only 1/3 of them will fall out of the methanol. I am assuming all triglyceride molecules will fall out and all the FAME molecules will end up in the methanol. (Opinions on this very welcome)
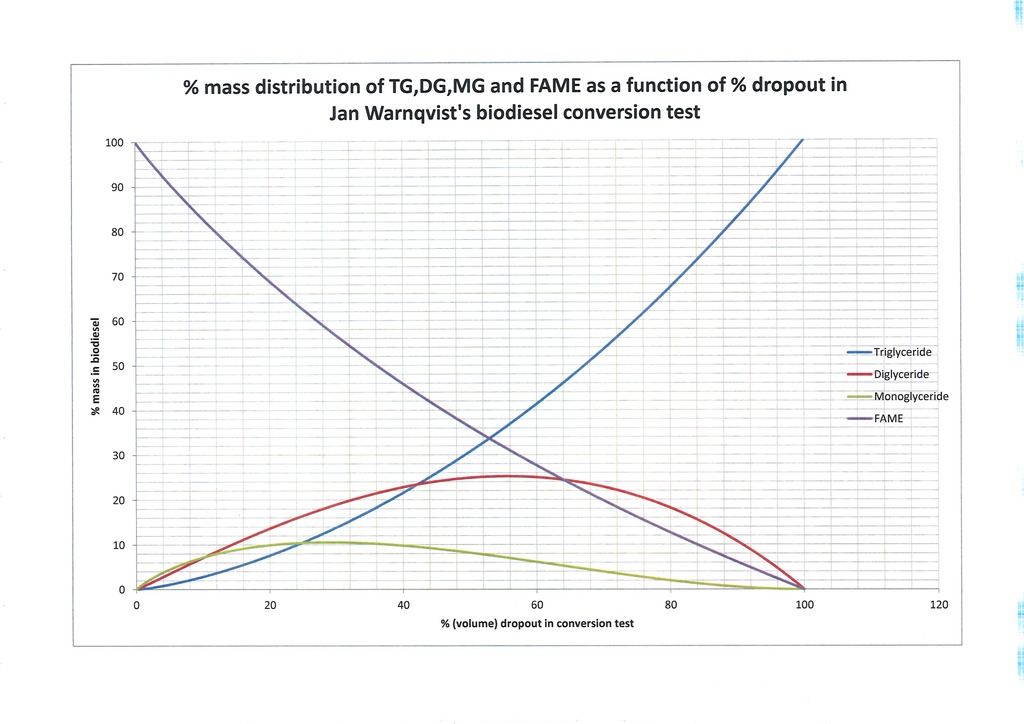
Now to some actual results. What the first series of graphs, (Figures 1-3) represent I will now explain. The horizontal axis variable represents the % dropout from the sample of biodiesel used in the Warnqvist test. It ranges from 0% representing no dropout at all (complete conversion) to 100% in which the entire sample drops out of the methanol (zero conversion/pure triglyceride oil). These are the theoretical endpoints. We then have a continuum of possibilities in between ‘mapping’ all possible degrees of conversion. The vertical axis represents the -glyceride % distribution (by mass) in the biodiesel in your processor from which the test sample was taken. As a purely numerical example suppose someone took a sample of biodiesel from their processor and after letting the glycerol settle, they measured out a 25ml sample and carried out the methanol test on it with 225ml of methanol. Suppose after the requisite time they found that they had 16ml of dropout in the flask. That amounts to 64% dropout. Looking at Figure 1 tells them that the biodiesel in the processor at the time the sample was withdrawn was comprised of (reading approximately from Figure 1) 5.5% monoglycerides, 24.25% diglycerides, 46% triglyceride and 24.25% FAME.
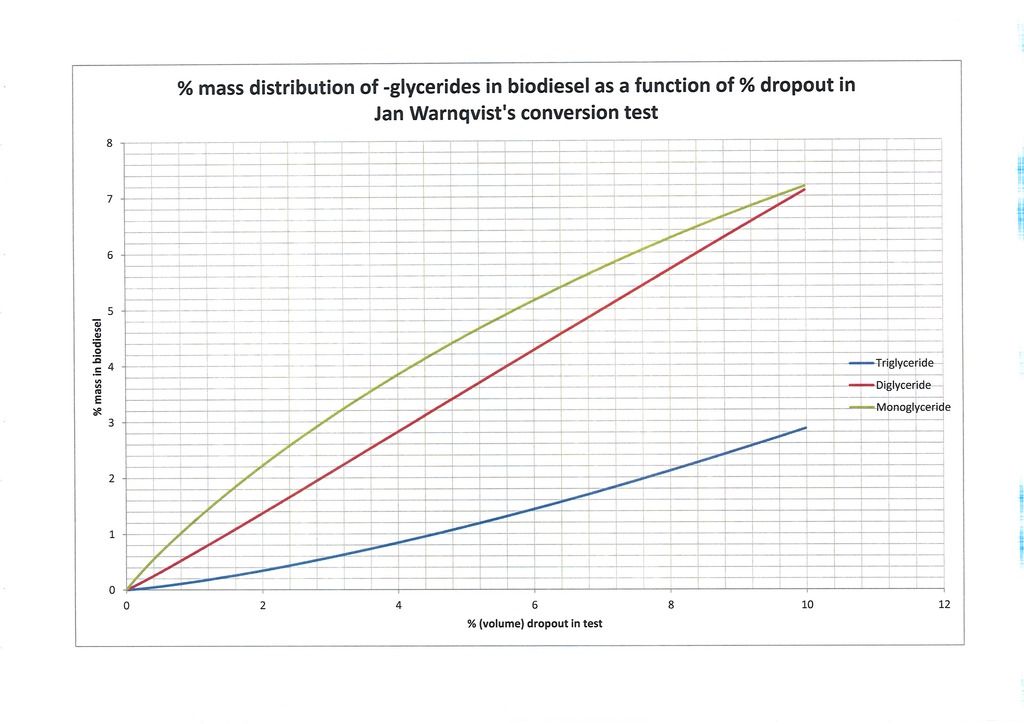
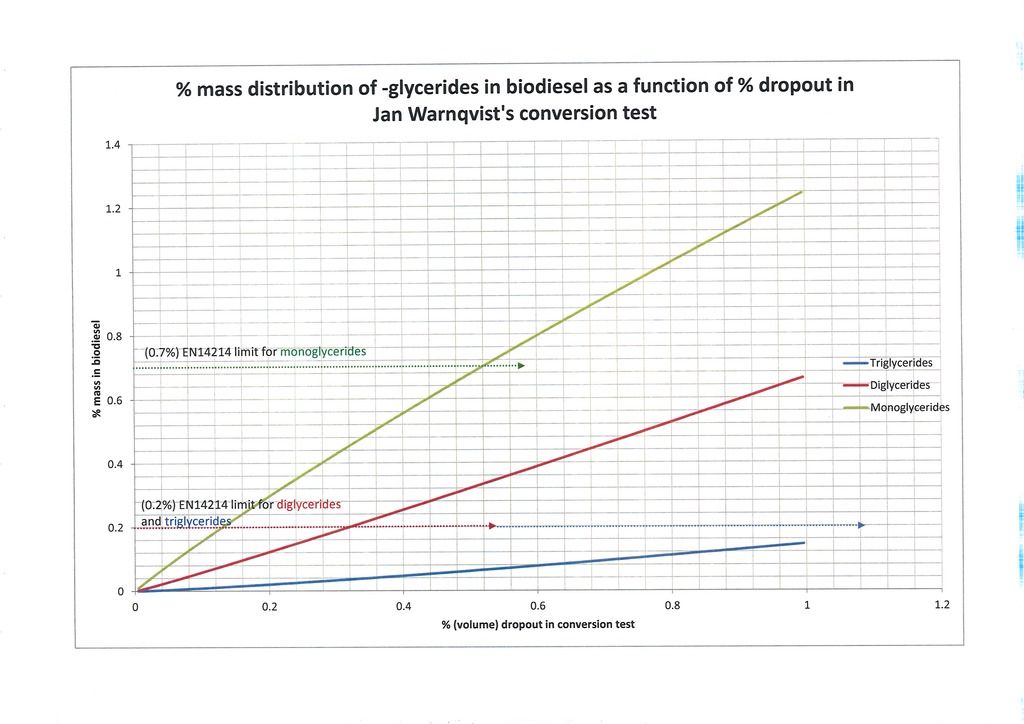
Figure 2 and Figure 3 simply zoom in a little closer. Figure 2 shows detail for dropout from 0% to 10%. Figure 3 is more interesting because in it we are down at the levels where most producers are aiming. I have inserted horizontal lines on the graphs indicating the EN14214 glyceride limits: 0.7% monoglyceride and 0.2% di- and triglyceride. According to my model and the assumed feedstock oil (1, 2/3, 1/3) we can see it predicts the maximum dropout percentage which can be expected to potentially meet the EN14214 standards for glyceride content. It can be seen in this case the diglyceride constraint is the most restrictive and dropout of no more than 0.32% volume is allowed. In a 25/225ml test this would amount to an absolute volume of no more than 0.08ml dropout. At the moment most home brewers aim for no visible dropout and I myself am producing biodiesel with no dropout in the test so there is no better guide than that but the model potentially allows us to be quantitative and use the dropout volume to predict the precise makeup of the biodiesel at a given point in time.
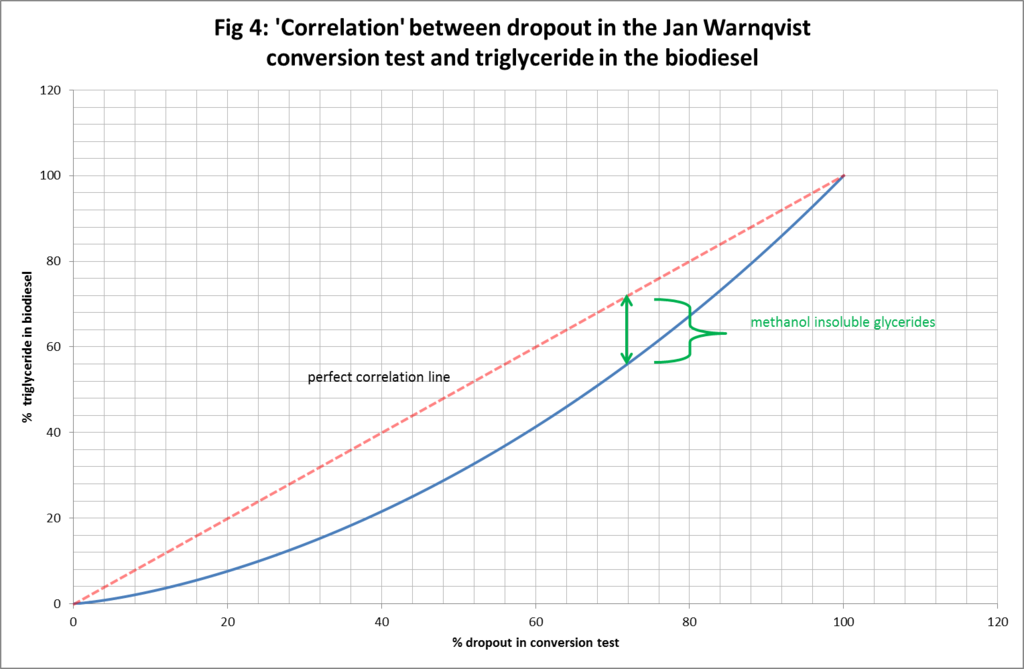
The latter point relates directly to another use for the Warnqvist test that has come to the fore and this is in a two-stage method (especially for those who go the no titration route) where they process in a first stage knowing they will not get complete conversion. They perform the test and use the dropout volume to predict how much methanol/caustic chemical to add in to the second stage to bring the process to completion. This process is typically used for fairly good oil to begin with but is known to bring down chemical usage and increase yield with less soap. So Warnqvist’s test is proving very useful at honing the economics of the process not just quality testing in the latter stages. This is one of the reasons I wanted to attempt to map the dropout % to -glyceride distribution in the biodiesel right across the range of conversion levels and brings me to presenting a couple more graphs for your consideration. They are not earth shattering revelations but suggest that my model gives an illustration of how and why the above two-stage biodiesel processing approach works. Many brewers assume, as a rule of thumb in the two-stage process, “perfect correlation” between % dropout and the amount of oil left to convert. As they are unable to determine the mix of –glycerides in the dropout the assumption is that it is all triglyceride. So the perfect correlation assumption gives them a useful upper bound on the true level of triglyceride in the biodiesel and as such means that when they do their calculations for chemicals they are always slightly overdosing resulting in very good conversion, perhaps at the cost of slightly reduced yield and increased soap production as a result of overdosing. The graphs below may, upon further development and testing of the model, allow producers to hone the chemical quantity calculation more precisely by being able to make a more informed assertion as to the -glyceride distribution of the oil remaining to be converted.
In any event, I enjoyed developing this model and graphing some results and even if this never proves to have a definite practical use I did enjoy the fact that it gives us insight and helps shed light on why certain assumptions being made by the home brewers actually work.
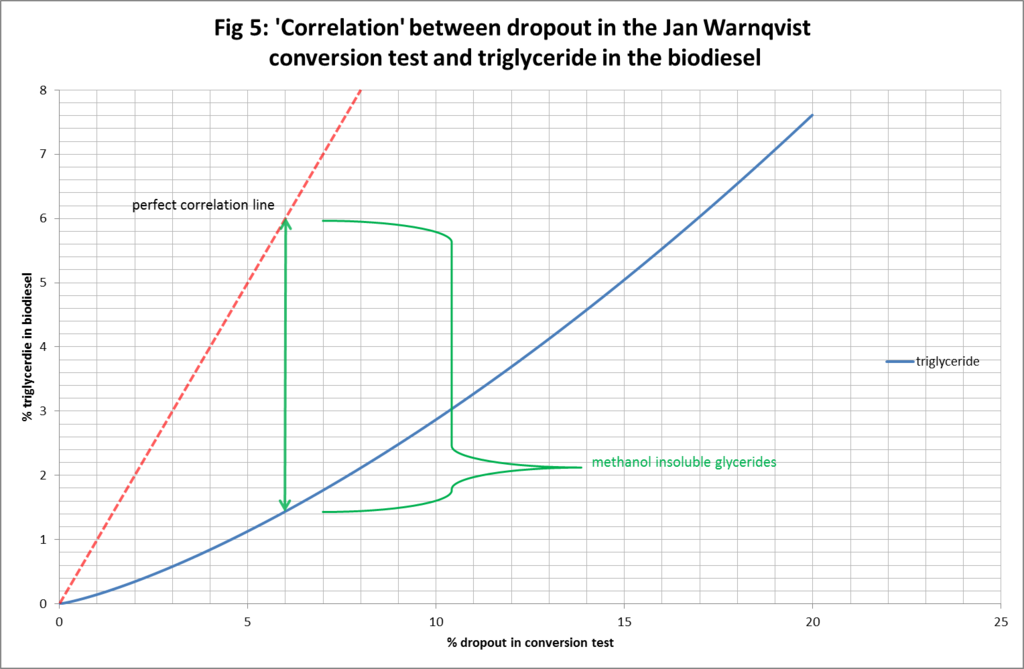
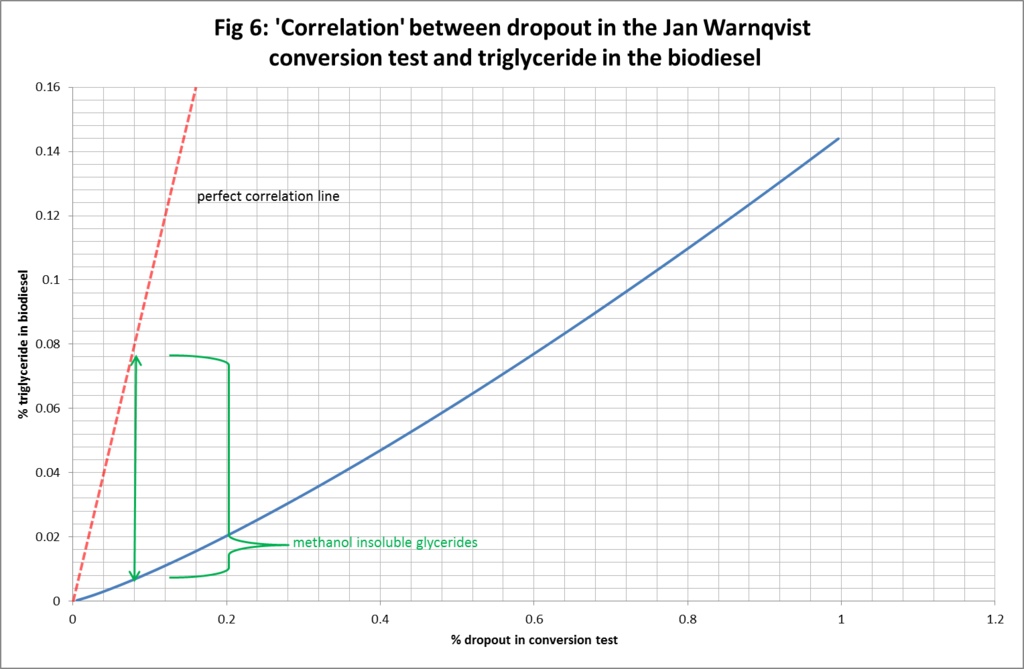
Figures 4-6, illustrate the deviation from perfect correlation of the true level of triglyceride in the biodiesel and the presumed amount based on the % dropout in the test. Figure 4 shows the connection right across the dropout range from 0% to 100%. It can be seen that the vertical gap between the assumption of perfect correlation and true level of triglyceride in the biodiesel varies as a function of the dropout: being better (in absolute terms but not relative terms) towards the endpoints and worse (in absolute terms but not relative terms) in the middle ranges. We can also identify the depth of the vertical gap as being a measure of the amount of methanol insoluble glycerides (di and mono) in the biodiesel. Figure 5 and Figure 6 simply zoom in for greater clarity and detail at lower levels of % dropout.